Advance Iris Dataset Analysis and Visualization
Explored the Iris dataset using exploratory data analysis (EDA) and clustering techniques.
Project Overview
This project aims to analyze the famous Iris dataset using various visualization techniques to better understand the relationships between the features and how they contribute to the differentiation of species. We have included multiple types of visualizations to explore the dataset and added insights drawn from each plot. The project is especially useful for those who are new to exploratory data analysis (EDA) and clustering techniques.
Project Preview
Open Github RepositoryDataset
The dataset used for this analysis is the Titanic dataset available from the Seaborn library, which is a cleaned version of the original Titanic dataset from Kaggle.
Project Summary
We explored the Iris dataset using the following techniques:
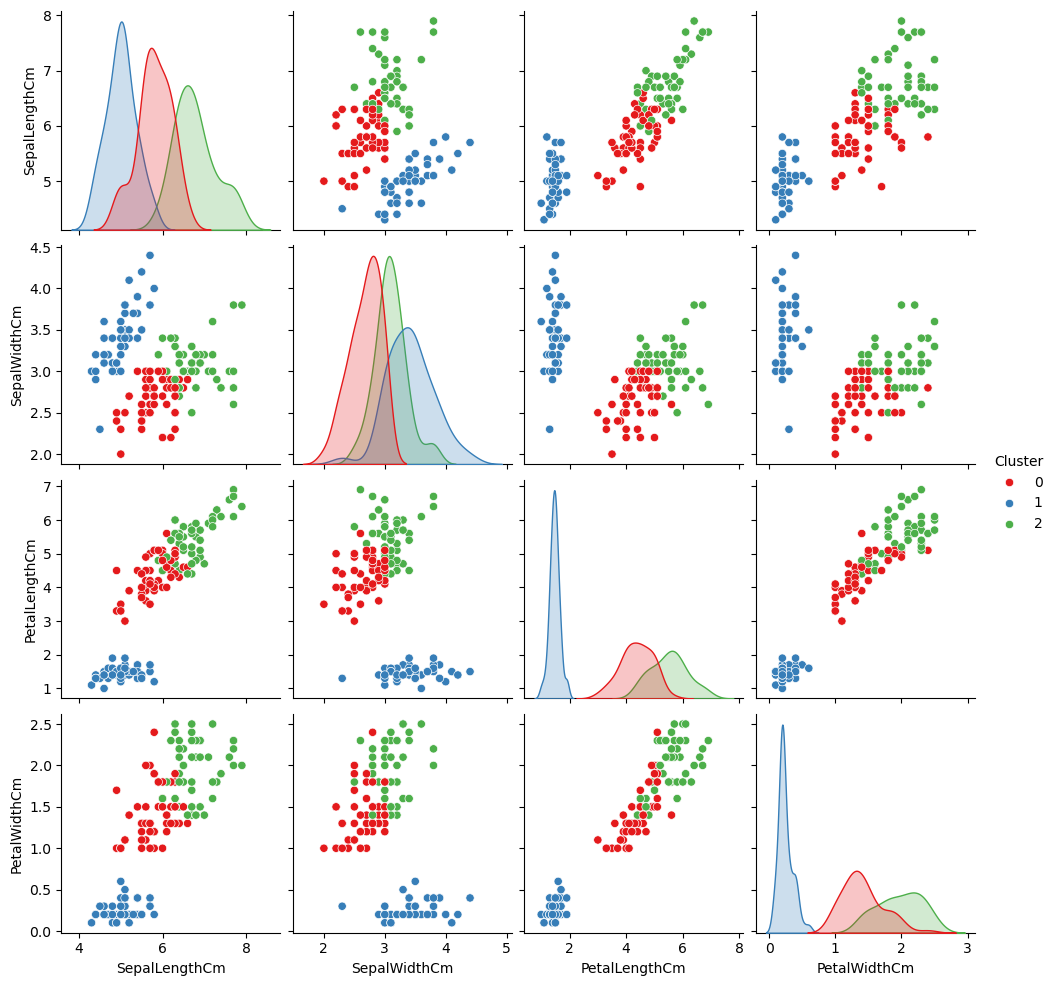
1. Pairplot (Seaborn)
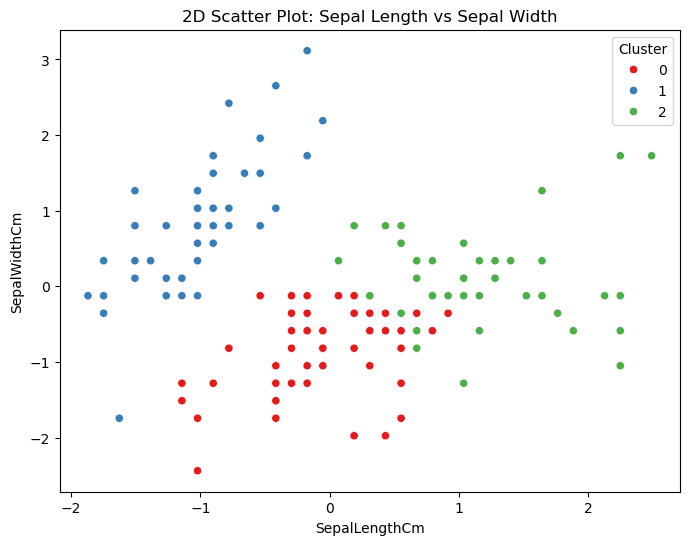
2. Scatter Plot (Sepal Length vs. Sepal Width)
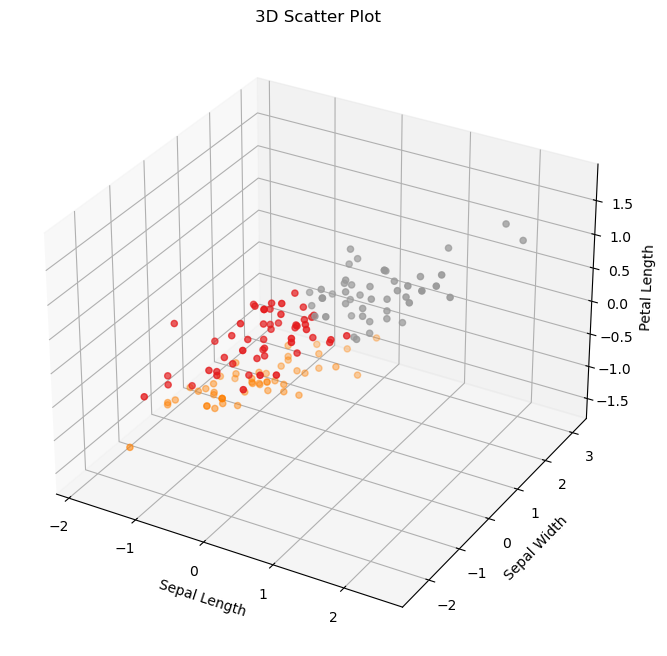
3. 3D Scatter Plot (Matplotlib)
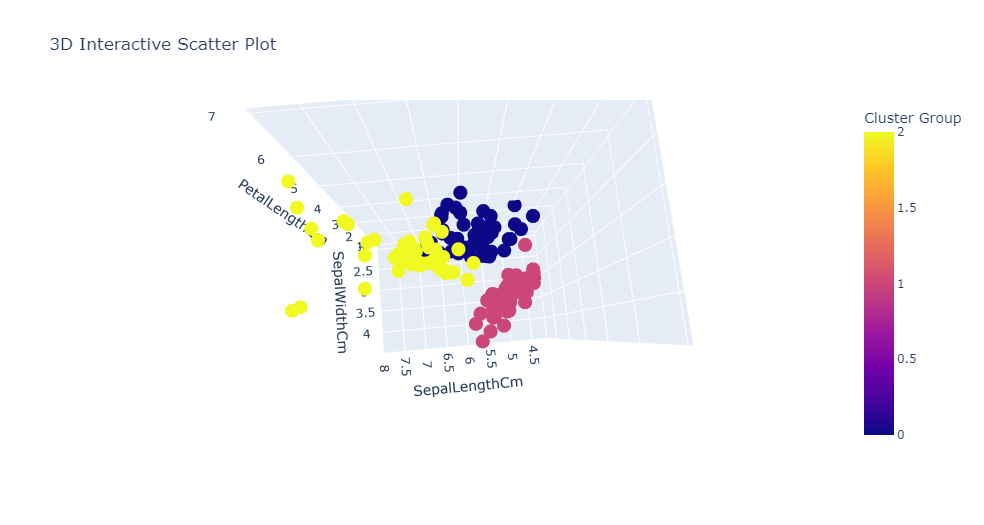
4. Interactive 3D Plot (Plotly)
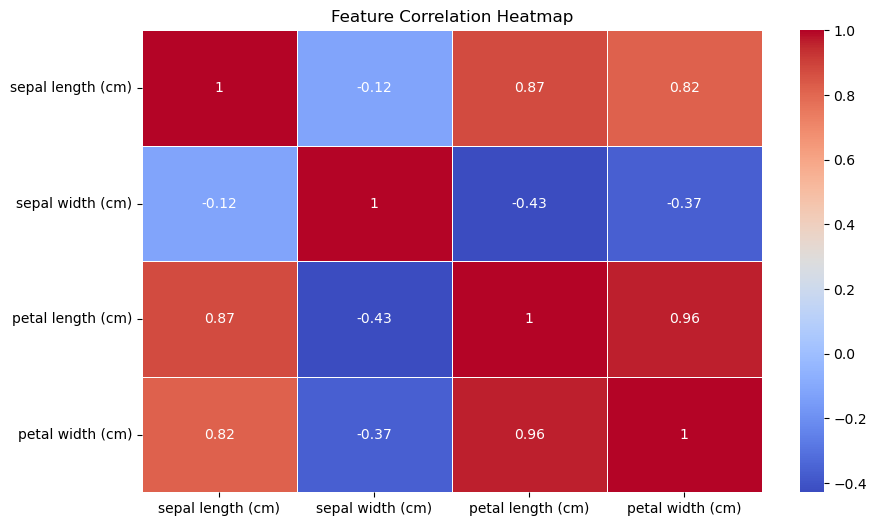
5. Correlation Heatmap (Seaborn)
These visualizations helped in understanding the relationships between the four key features of the dataset:
1. Sepal Length
2. Sepal Width
3. Petal Length
4. Petal Width
How to Use This Repository
1. Clone the Repository
To get started, clone this repository to your local machine using the following command:
git clone https://github.com/Durveshbaharwal/Advance-IRIS-Data-Analysis
cd Advance-IRIS-Data-Analysis2. Install dependencies:
You can install the required libraries using pip:
pip install pandas numpy matplotlib seaborn plotly scikit-learn2. Run the Jupyter notebook:
Run the Jupyter notebook (IRIS-Data-Analysis.ipynb) to execute the code and see the visualizations:
jupyter notebook IRIS-Data-Analysis.ipynbProject Gallery