Titanic Data Analysis & Visualization
an advanced analysis of the Titanic dataset
Project Overview
Performed feature engineering, create visualizations, and build predictive models to understand the factors that influenced survival rates.
Project Preview
Open Github RepositoryDataset
The dataset used for this analysis is the Titanic dataset available from the Seaborn library, which is a cleaned version of the original Titanic dataset from Kaggle.
Features
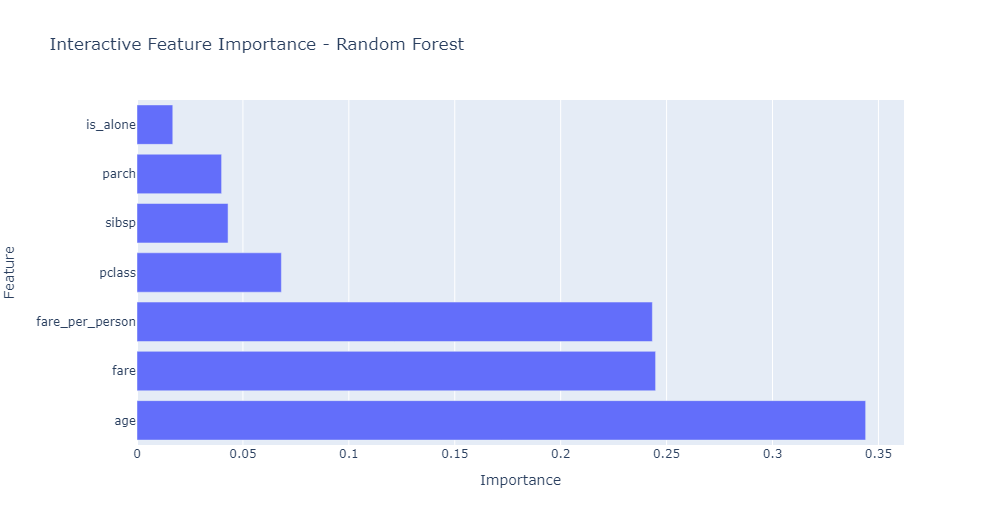
The following features were used in the analysis:
1. pclass: Passenger class (1st, 2nd, 3rd)
2. age: Age of the passenger
3. sibsp: Number of siblings/spouses aboard
4. parch: Number of parents/children aboard
5. fare: Ticket fare
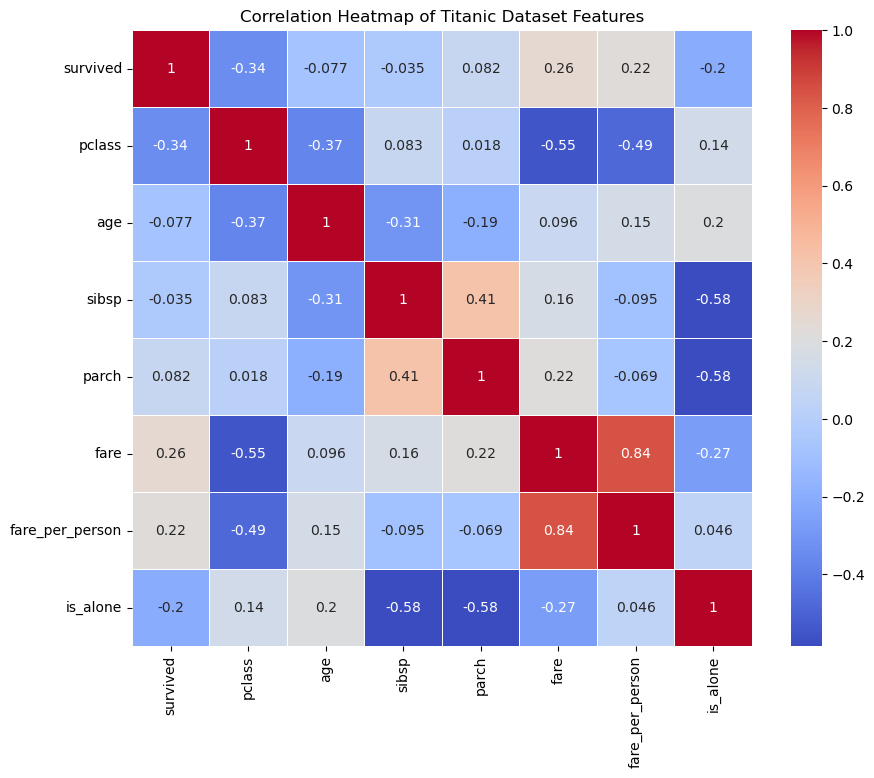
6. fare_per_person: Fare per person, calculated as fare / (sibsp + parch + 1)
7. is_alone: Binary feature indicating if a passenger is traveling alone
How to Use This Repository
1. Clone the Repository
To get started, clone this repository to your local machine using the following command:
git clone https://github.com/Durveshbaharwal/Advance-Titanic-Data-Analysis-and-Visualization
cd Advance-Titanic-Data-Analysis-and-Visualization2. Install dependencies:
You can install the required libraries using pip:
pip install pandas seaborn matplotlib plotly scikit-learn lifelinesProject Gallery