Seismic Detection Across the Solar System
Applied 5+ algorithms Achieving 96% accuracy
Project Overview
This project focuses on analyzing seismic data from various planetary bodies within our solar system using advanced algorithms, data visualization techniques, and an interactive web app built with Streamlit. The goal is to classify and detect seismic activity on planets, moons, and other celestial bodies based on received seismic data, advancing our understanding of geological processes beyond Earth.
Project Preview
Open Github RepositoryRepository Structure
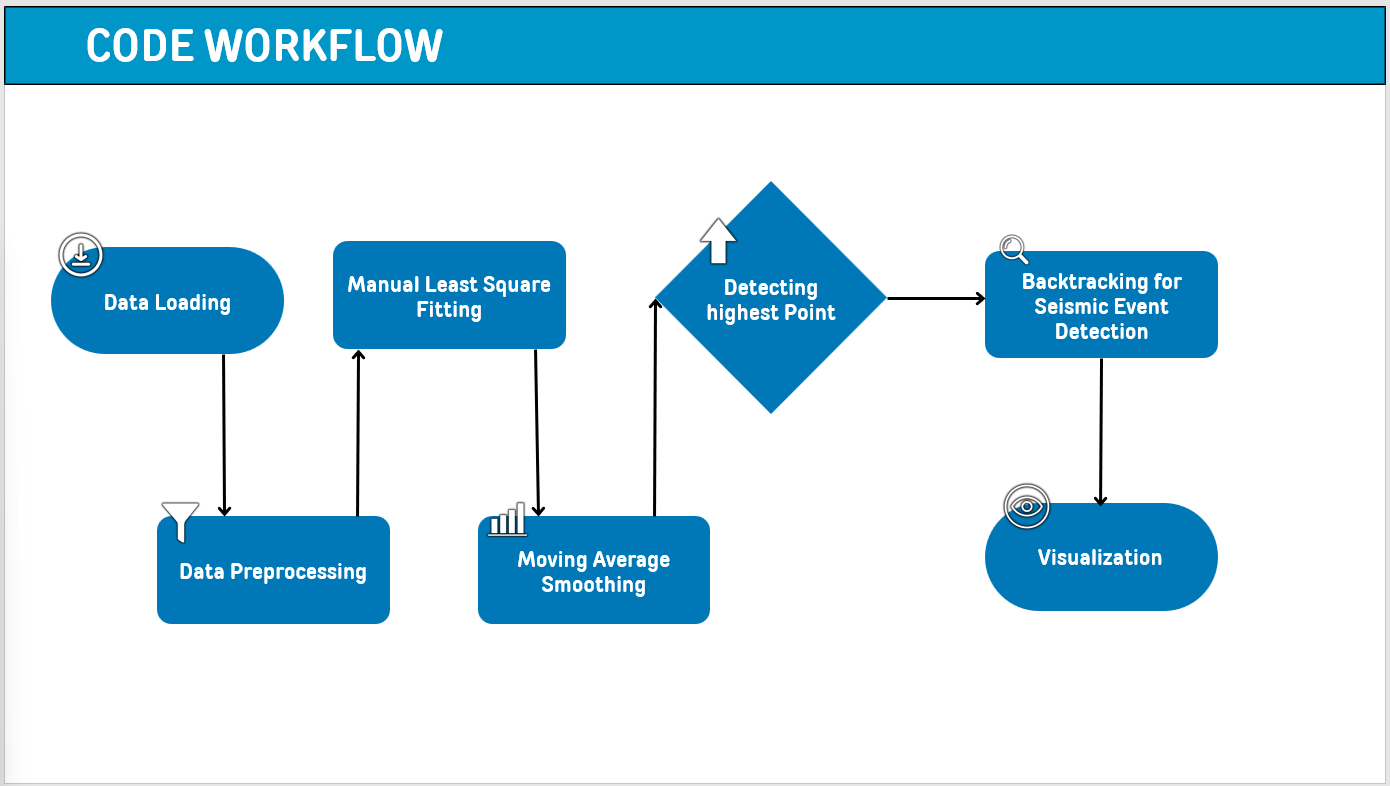
1. seismic_app.py: A Python script containing functions for processing seismic data, including data preprocessing, feature extraction, and seismic event classification. It also includes the code for running the Streamlit app.
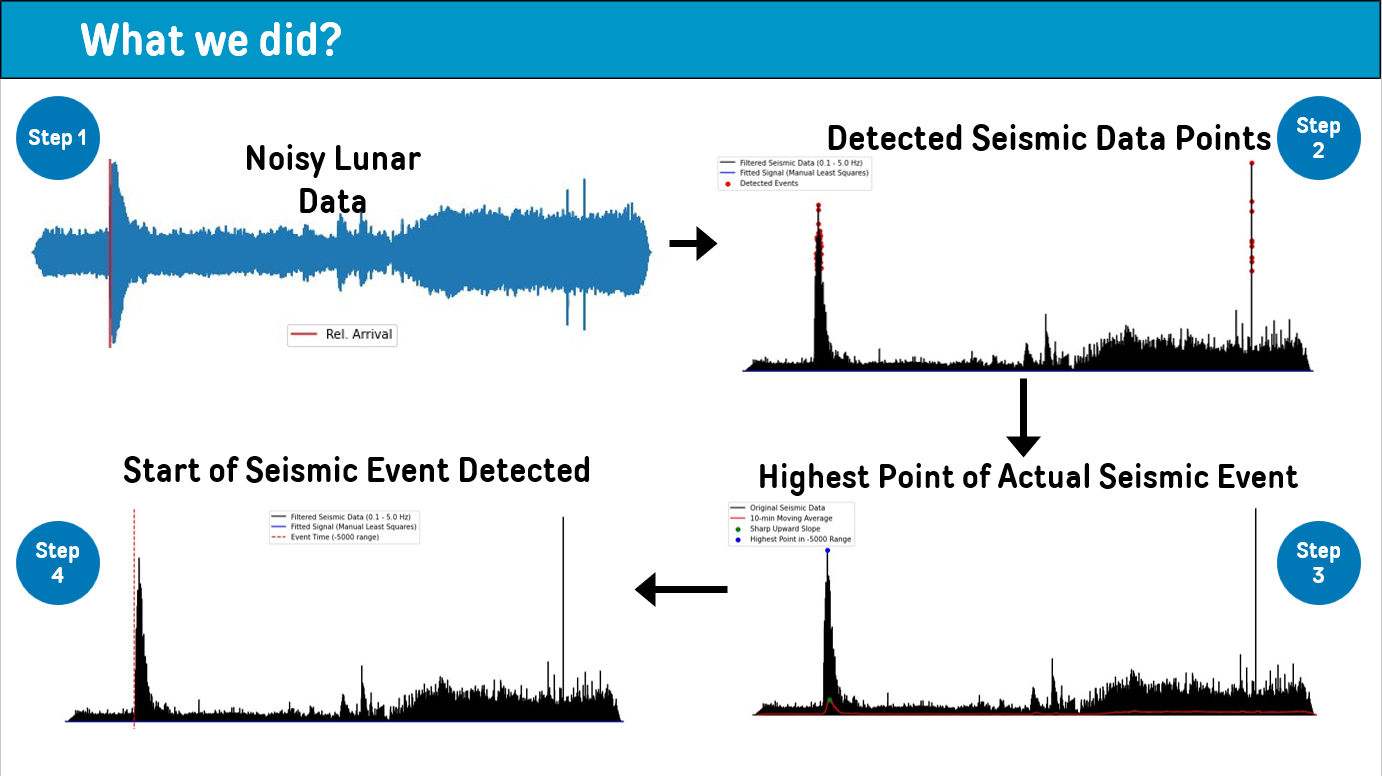
2. DOT.ipynb: A Jupyter notebook that provides a detailed step-by-step guide on the methods used for seismic data analysis, including data visualization, model training, and evaluation.
3. /output/: A subfolder that contains 76 output plots generated during the analysis, including graphs and charts that visualize seismic data across different celestial bodies.
How to Use This Repository
1. Requirements:
To run the Python script, Jupyter notebook, and Streamlit app, you will need the following dependencies:
Python 3.x NumPy Pandas ObsPy Matplotlib Streamlit
You can install all required dependencies by running the following command:
pip install -r requirements.txtRunning the Code
2. Clone the Repository
To get started, clone this repository to your local machine using the following command:
git clone https://github.com/Durveshbaharwal/DOT_Seismic_Detector.git
cd DOT_Seismic_Detector3. Exploring the Jupyter Notebook
Open the DOT.ipynb notebook in Jupyter to explore the step-by-step analysis of seismic data:
jupyter notebook DOT.ipynbThe notebook includes detailed markdown explanations, code cells, and visualizations that walk you through the entire process of seismic data analysis. Feel free to modify the code cells and experiment with the data.
4. Running the Python Script:
To run the seismic data analysis through the Python script, execute the following command in your terminal:
python seismic_app.pyThis script handles seismic data processing and classification based on input datasets. It automatically saves the output plots in the output/ folder for further examination.
5. Running the Streamlit App:
The repository also includes a Streamlit app for interactive data exploration and visualization of the seismic data. You can run the Streamlit app using the following command:
streamlit run seismic_app.pyThis will launch a local web app where you can interact with the data, visualize seismic events, and explore different planetary bodies' seismic activity in real time.
Analyzing Output Plots
The output/ folder contains 76 output plots, which include various data visualizations related to seismic activities on different planetary bodies. You can review these plots to understand the distribution, classification, and patterns of seismic events across the solar system.
Project Focus
This project is centered on analyzing seismic data that is received periodically (every 24 hours) from different planetary bodies. By using a combination of deep learning techniques and traditional seismic analysis, the repository aims to classify and identify seismic events and patterns across the solar system. This is an important step toward understanding planetary geology and could provide valuable insights for future space exploration missions.
Project Gallery